
Extra-P is an automatic performance modeling tool for HPC applications. It helps users understand how an application performs at large scale, for example, when increasing the number of computer processes or the application size. It can also identify performance bottlenecks, which are parts of the program whose scaling behavior is worse than expected. Extra-P uses empirical measurements of various performance metrics, such as runtime, energy consumption, hardware and software counters, and generates human-readable mathematical expressions that represent how each metric scales with the configurations. A powerful graphical user interface allows users to visually explore and compare the performance of different code regions and extrapolate behavior beyond the measured configurations.
Extra-P is developed at the High-Performance Computing Lab, TU Darmstadt, in collaboration with the Scalable Parallel Computing Laboratory, ETH Zurich.
Recommended reading
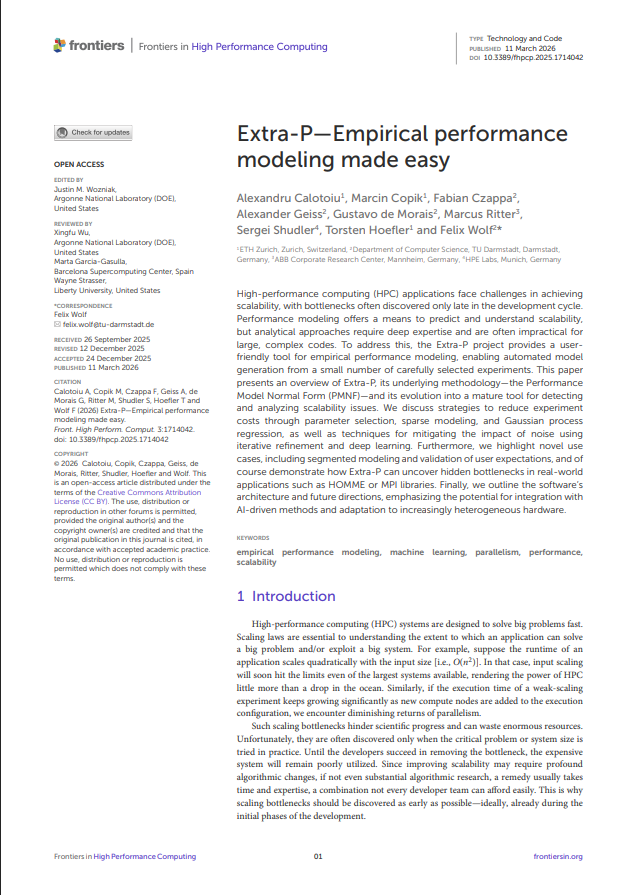
To learn more about the general analysis approach and architecture of Extra-P, please see:
A. Calotoiu, M. Copik, F. Czappa, A. Geiß, G. de Morais, M. Ritter, S. Shudler, T. Hoefler, and F. Wolf.
Extra-P – Empirical Performance Modeling Made Easy.
Frontiers in High Performance Computing, 3–2025, 2026.
DOI: 10.3389/fhpcp.2025.1714042
Introductory video
Extra-P – A performance-modeling tool for applications on HPC systems
Core features
Extra-P automates the process of building performance models. It provides the following core features:
- Automatic generation of performance models from empirical measurements
Extra-P fits mathematical expressions directly from measurement data, requiring no manual tuning or prior knowledge of the application’s scaling behavior. - Single- and multi-parameter performance models
Model performance as a function of one or more execution parameters, such as the number of processes, the input size, or both. - GUI to visually explore the performance space
An interactive GUI lets users inspect, compare, and extrapolate models across code regions. - Command-line interface for (agentic) workflows
A command-line interface enables users to generate and verify performance models without the GUI, making it suitable for automated pipelines and scripted workflows.
Analysis workflow
Extra-P is designed to work with a small number of experiments. The steps below outline how to go from raw measurements to performance models:
- Collect performance measurements
Use a profiler, such as Score-P, to record metrics of interest from your application. To do so, run your application multiple times, varying one or more parameters. - Load the measurements into Extra-P
Extra-P accepts several input formats, including Cube, text, and JSON files. - Extra-P generates performance models
For each measured code region, Extra-P fits a mathematical expression describing how the metrics scale with the chosen configuration parameters. - Extrapolate models to identify scalability performance and bottlenecks
Use the GUI to visualize and compare models across configurations.
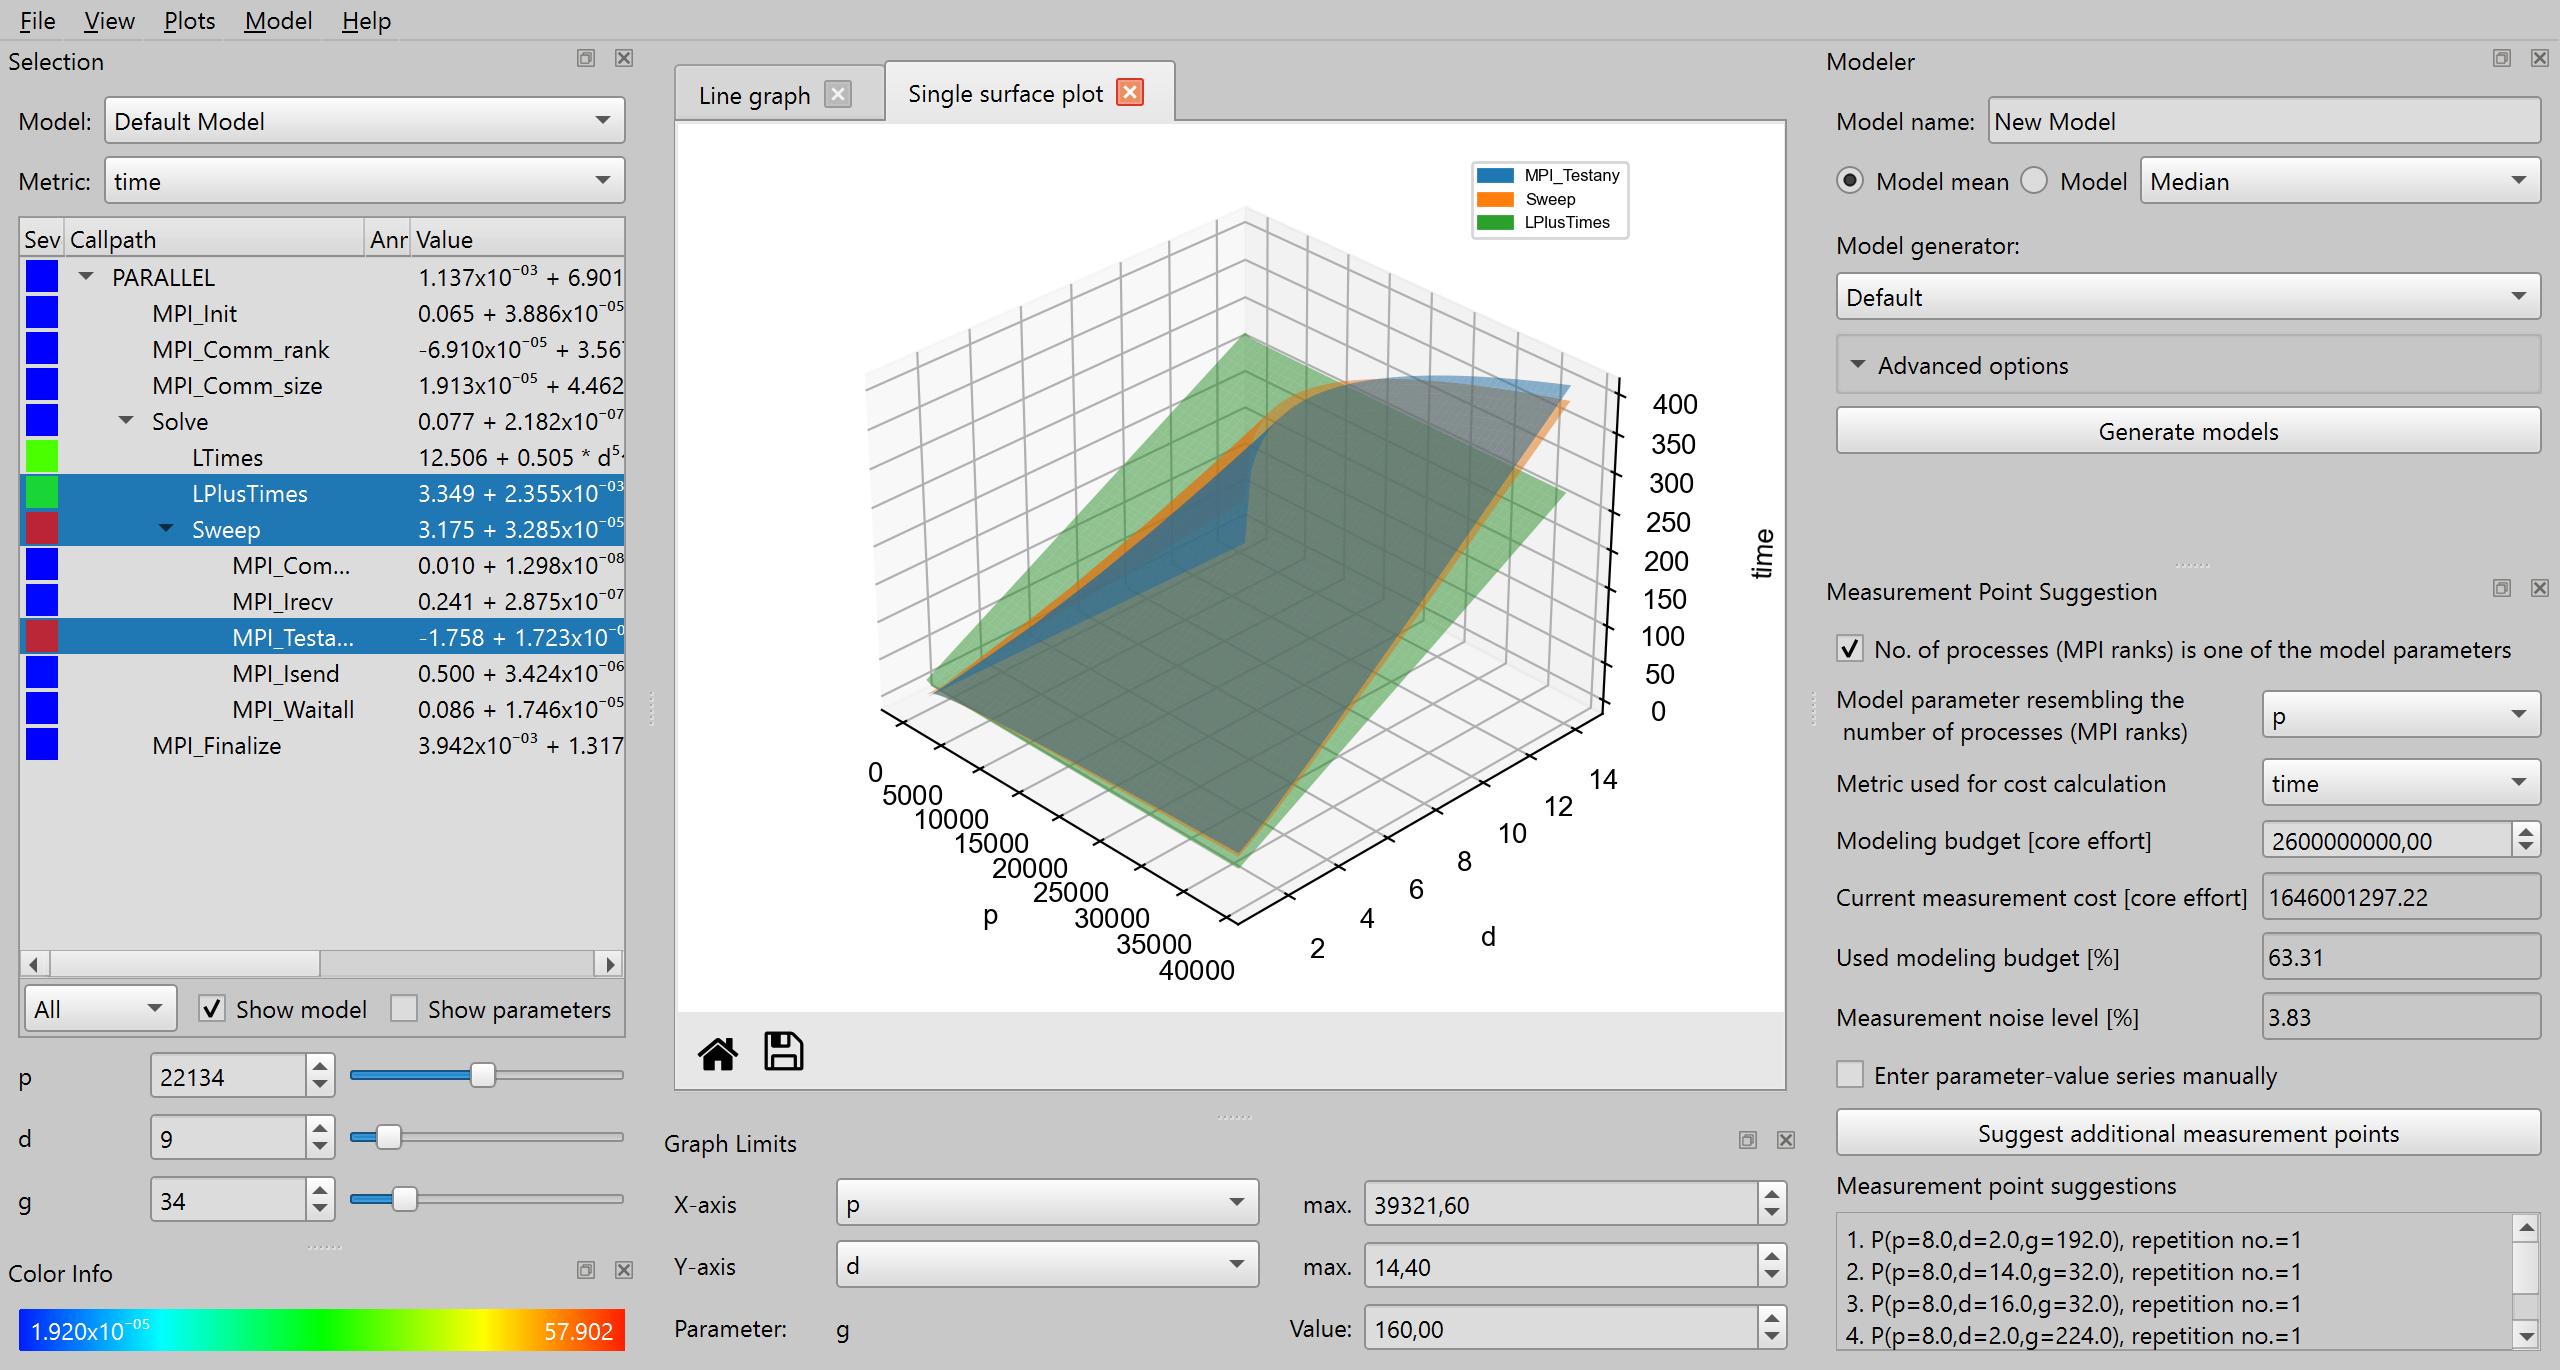
Example of an application performance model in the Extra-P GUI
Recommended citations
If you find Extra-P helpful for your research, please reference it in your publications. To cite Extra-P in general, please use the following publication:
- A. Calotoiu, M. Copik, F. Czappa, A. Geiß, G. de Morais, M. Ritter, S. Shudler, T. Hoefler, and F. Wolf.
Extra-P – Empirical Performance Modeling Made Easy.
Frontiers in High Performance Computing, 3–2025, 2026.
DOI: 10.3389/fhpcp.2025.1714042
When referring to specific topics or components, please use one (or more) of the following:
-
A. Calotoiu, T. Hoefler, M. Poke, and F. Wolf.
Using Automated Performance Modeling to Find Scalability Bugs in Complex Codes.
In Proc. of the International Conference on High Performance Computing,
Networking, Storage and Analysis (SC ‘13), pages 45:1–45:12, ACM, 2013.
DOI: 10.1145/2503210.2503277 -
A. Calotoiu, D. Beckingsale, C. W. Earl, T. Hoefler, I. Karlin, M. Schulz, and F. Wolf.
Fast Multi-Parameter Performance Modeling.
In Proc. of the 2016 IEEE International Conference on Cluster Computing (CLUSTER),
Taipei, Taiwan, pages 172–181, IEEE, September 2016.
DOI: 10.1109/CLUSTER.2016.57 -
M. Ritter, A. Calotoiu, S. Rinke, T. Reimann, T. Hoefler, and F. Wolf.
Learning Cost-Effective Sampling Strategies for Empirical Performance Modeling.
In Proc. of the 34th IEEE International Parallel and Distributed Processing
Symposium (IPDPS), New Orleans, LA, USA, pages 884–895, IEEE, May 2020.
DOI: 10.1109/IPDPS47924.2020.00095 -
M. Ritter, A. Geiß, J. Wehrstein, A. Calotoiu, T. Reimann, T. Hoefler, and F. Wolf.
Noise-Resilient Empirical Performance Modeling with Deep Neural Networks.
In Proc. of the 35th IEEE International Parallel and Distributed Processing
Symposium (IPDPS), Portland, Oregon, USA, pages 23–34, IEEE, May 2021.
DOI: 10.1109/IPDPS49936.2021.00012 -
A. Geiß, T. Hovi, A. Calotoiu, and F. Wolf.
Validating the Performance of GPU Ports Using Differential Performance Models.
Future Generation Computer Systems, 174:108018, January 2026.
DOI: 10.1016/j.future.2025.108018 -
M. Ritter, B. Naumann, A. Calotoiu, S. Rinke, T. Reimann, T. Hoefler, and F. Wolf.
Cost-Effective Empirical Performance Modeling.
IEEE Transactions on Parallel and Distributed Systems, 37:575–592, February 2026.
DOI: 10.1109/TPDS.2025.3646119