
Functionality
To evaluate the behavior of parallel programs, Scalasca takes performance measurements at runtime to be analyzed postmortem (i.e., after program termination). The user of Scalasca can choose between two different analysis modes:
- Performance overview on the call-path level via runtime summarization (aka profiling)
- In-depth study of application behavior via event tracing
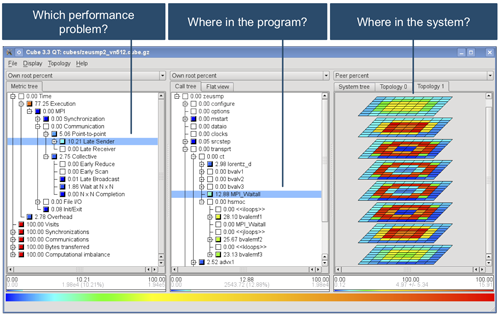
Browsing the performance behavior using the Scalasca report explorer.
In profiling mode, Scalasca generates aggregate performance metrics for individual function call paths, which are useful to identify the most resource-intensive parts of the program and to analyze process-local metrics such as those derived from hardware counters. In tracing mode, Scalasca goes one step further and records individual performance-relevant events, allowing the automatic identification of call paths that exhibit wait states. In both cases, the resulting reports can be interactively explored in a graphical browser (see figure above).
As an alternative, the resulting traces can be visualized in a third-party time-line browser such as Vampir to study the detailed interactions among different processes or threads. While providing more behavioral detail, traces also consume significantly more storage space and therefore have to be generated with care.